Power BI is an interactive data visualisation software product developed by Microsoft. Its primary focus is business intelligence. You can find out more about Power BI in this introduction for GIS teams video. Featuring David Renn, an experienced ex-public sector GIS specialist, this video explains how Power BI can be used to produce interactive dashboards and reports.
What are the benefits of iShare Insights with Power BI?
As David says, “iShare Insights brings data to life, no matter how many datasets you need to analyse. It’s brilliant for giving people without the expertise or specialist software the ability to analyse data more effectively and make data-led decisions. It also makes reporting easy.”
Can you show us examples of different dashboards?
Yes, in this video David demonstrates a variety of reports and dashboards.
Can non-GIS users use iShare Insights to analyse data in Power BI?
Yes. iShare Insights enables non-specialists to create custom visualisations. To mark GIS Day in 2023, we published a video to help non-GIS users understand its capabilities.
Do you have any user guides or videos to help us understand how we can bring data into iShare Insights?
Yes, we have a range of tutorial videos showing you how to use point and polygon data. We’re also working on some in-depth user guides. These will be available via our iShare Help pages soon.
Can we download pre-styled Astun Data Services (ADS) data for use in Power BI?
Yes. Andrew Bailey, one of our GIS consultants, shows you how to do this using crime data in our first tutorial video. You’ll learn how to define a bounding box using a VRT file and push the data to a table. Once the data is in the database, you can see the data on a map. You’ll discover how a DELETE statement in SQL trims the street crimes against the county border.
Can you share pre-styled ADS data through an API?
In our second tutorial, Andrew demonstrates how to expose data through iShare’s API for consumption by Power BI, using a SELECT statement. This data is then available to Power BI as a WebRequest and can be downloaded as a CSV document.
How do we import data into a blank project?
Our third tutorial shows you how to add data to a blank project using a blank query to make a web request to the iShare Maps API.
Can we import additional data into a file for use in Power BI?
Yes, you can. In our fourth tutorial, you’ll learn how to bring in additional data from a .TXT file containing RGB values in hexadecimal. This data controls the fill and outline colours when displaying point objects on your map.
Is adding a map to a Power BI report easy?
It is if you watch tutorial five! You’ll learn how to use Icon Map, available from the Visuals Marketplace or here, to add a map to your report. You’ll find out how to resize the map window, match data fields and apply conditional formatting to the fill colour to help users interpret the data.
What other visualisations can we add alongside our map?
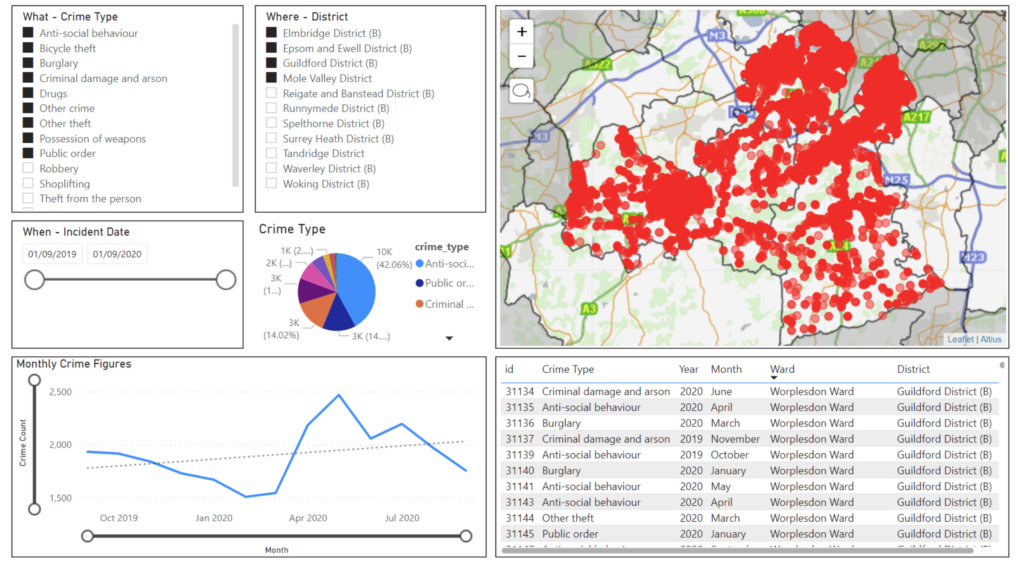
You have several choices. Our sixth tutorial shows you how to access these, using a slicer as an example. Slicers enable users to filter data, e.g. by district/ward or by crime type. Any changes made are reflected immediately on your map. Our seventh tutorial shows you how to add a pie chart visual showing crime types and align the colour values to match your map.
Do you have any other videos?
In the last tutorial in the series, Andrew shows you how to visualise and analyse polygon data. He demonstrates how to build an Index of Multiple Deprivation report with the help of the Icon Map visual. This will help your decision-makers to target services for disadvantaged residents more effectively.
Next steps
To make life easier, we’ve grouped the videos into two playlists. You can choose from the introductory playlist or the tutorial playlist. You can also access these from our iShare Insights web page.
If you’re interested in using iShare Insights with Power BI, please contact us.