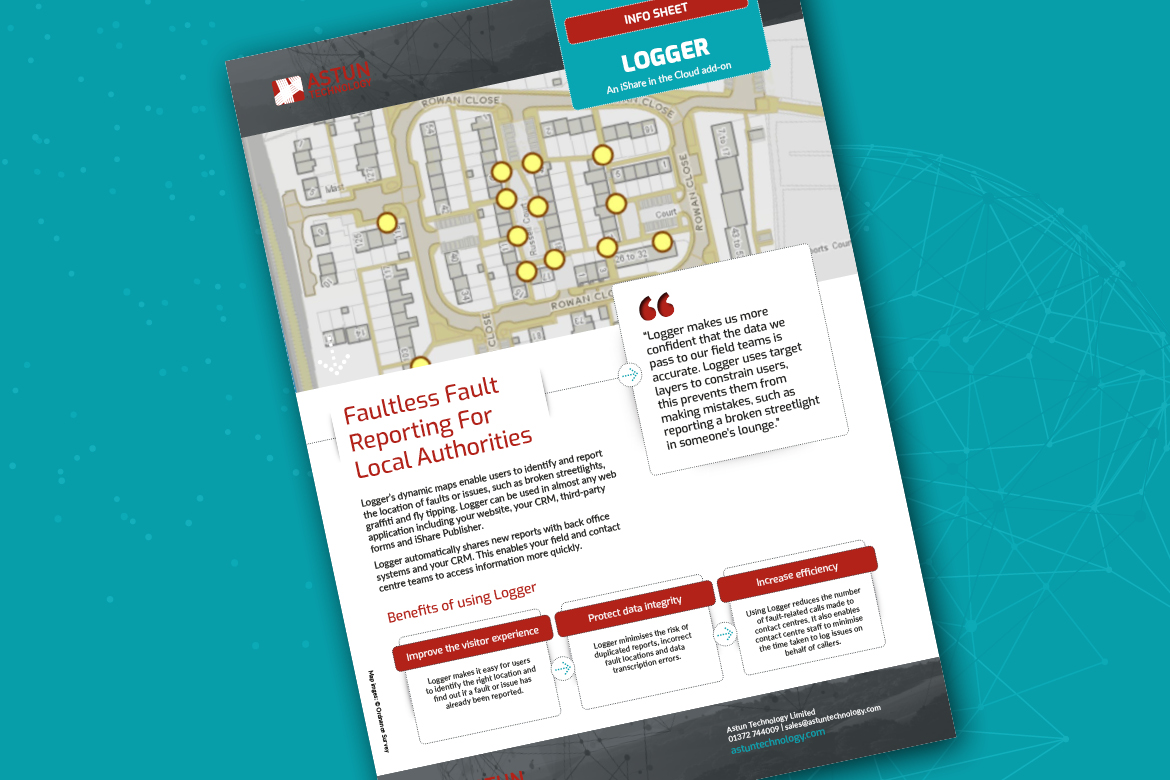
User-friendly fault reporting
Are poor-quality fault reports hampering your service delivery?
Inaccurate reports make it difficult for maintenance teams to efficiently repair faults and issues, such as broken streetlights, potholes and flytipping.
Logger, an add-on to iShare in the Cloud (iSiC), improves report accuracy by enabling residents to use a map to pinpoint the location of a fault or issue.
Logger can include data from iSiC in the fault reporting process and simplify the sharing of contextual information with back office systems.
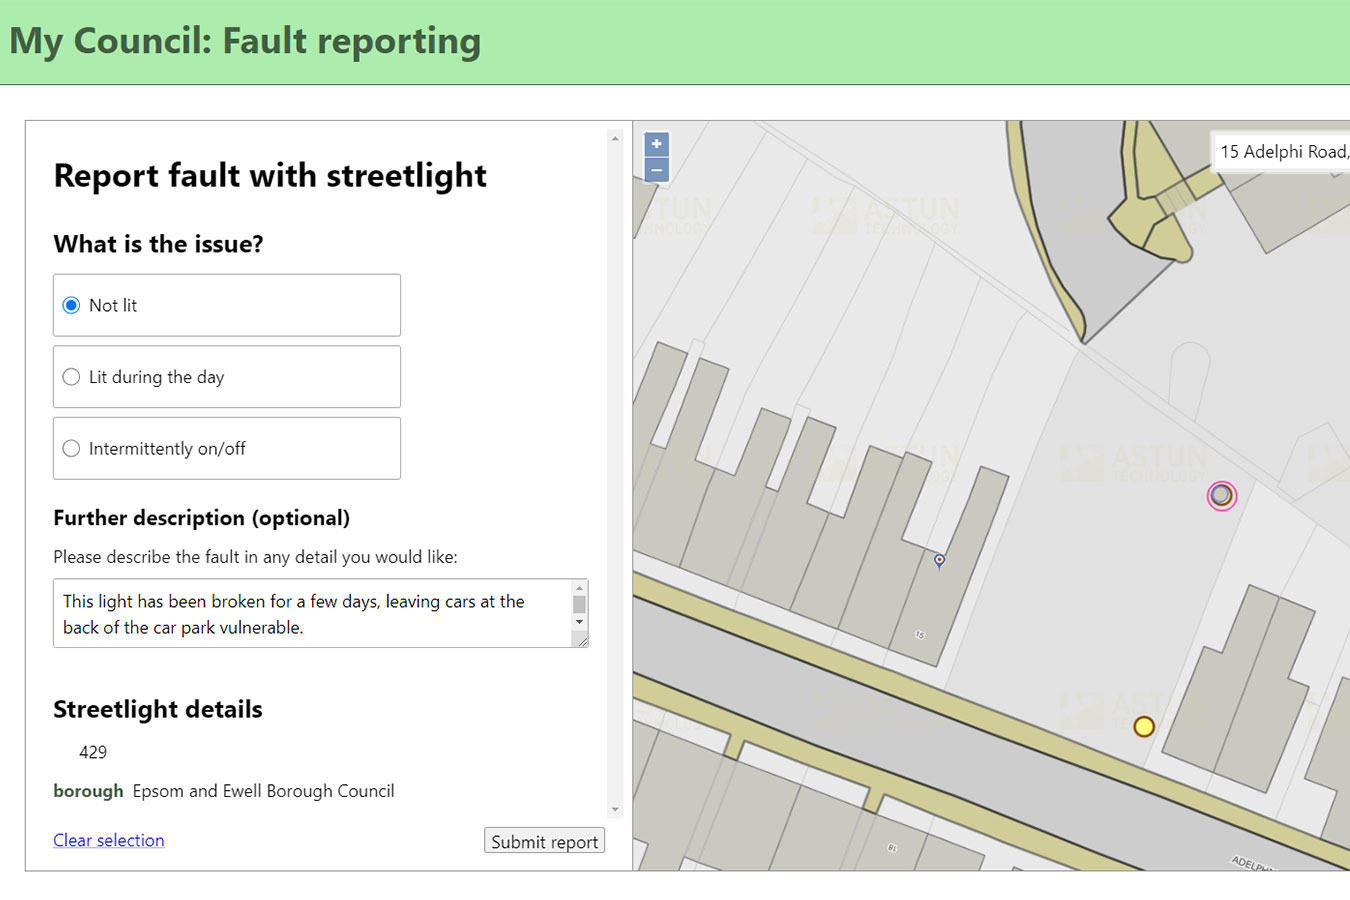
Benefits of using Logger
This simple tool offers benefits across the board

Your organisation
Improve service delivery by automatically triggering repair workflows

Your colleagues
Liberate contact centre call handlers from repetitive fault report calls
Your data
Minimise the risk of incorrect reports, duplicated reports and data transcription errors

Your community
Improve the website user experience by making it eaier to report faults via desktops and mobiles
Implementing Logger
The four step process to add Logger to your website
1
Getting started
We’ll give you documentation
and advice
2
Developing your app
Your web team will use our SDK and developer tools to build a web app
3
Publishing your webpage
Residents will be able to use the app on your website to report faults
4
Reporting/integration
If configured, Logger will automatically pass information to your CRM and/or back office systems for further action
Step into your residents’ shoes
Use our demo to report a broken streetlight, new pothole or fly-tipping
Try our demoImprove the accuracy of reports
Logger’s map layers help users find locations, control where they can click and provide
additional information for maintenance teams
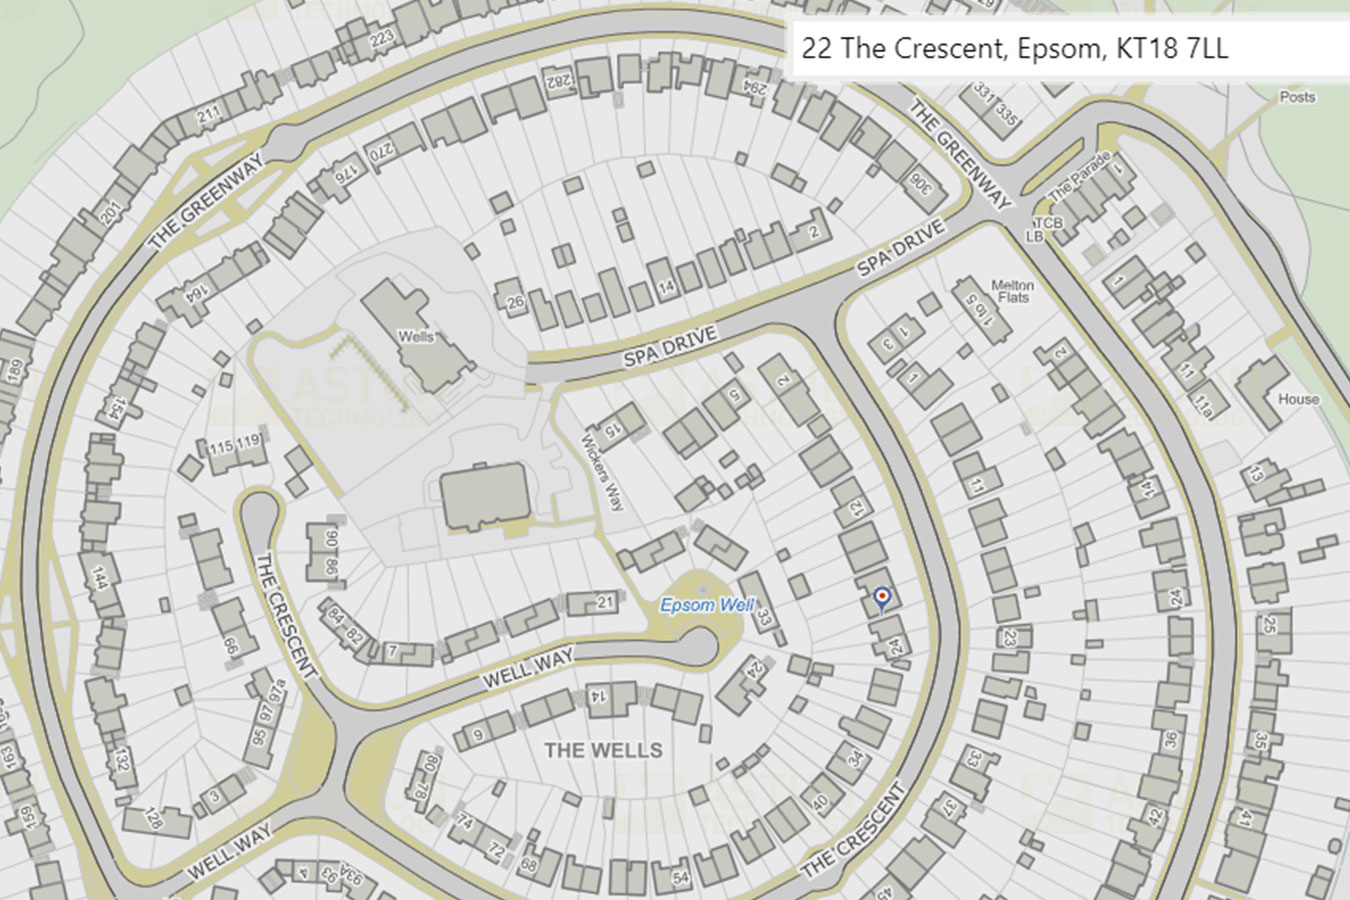
Map Layer
OS Premium base mapping helps your users identify the right location. You can configure aerial photography or other base maps in Logger too.
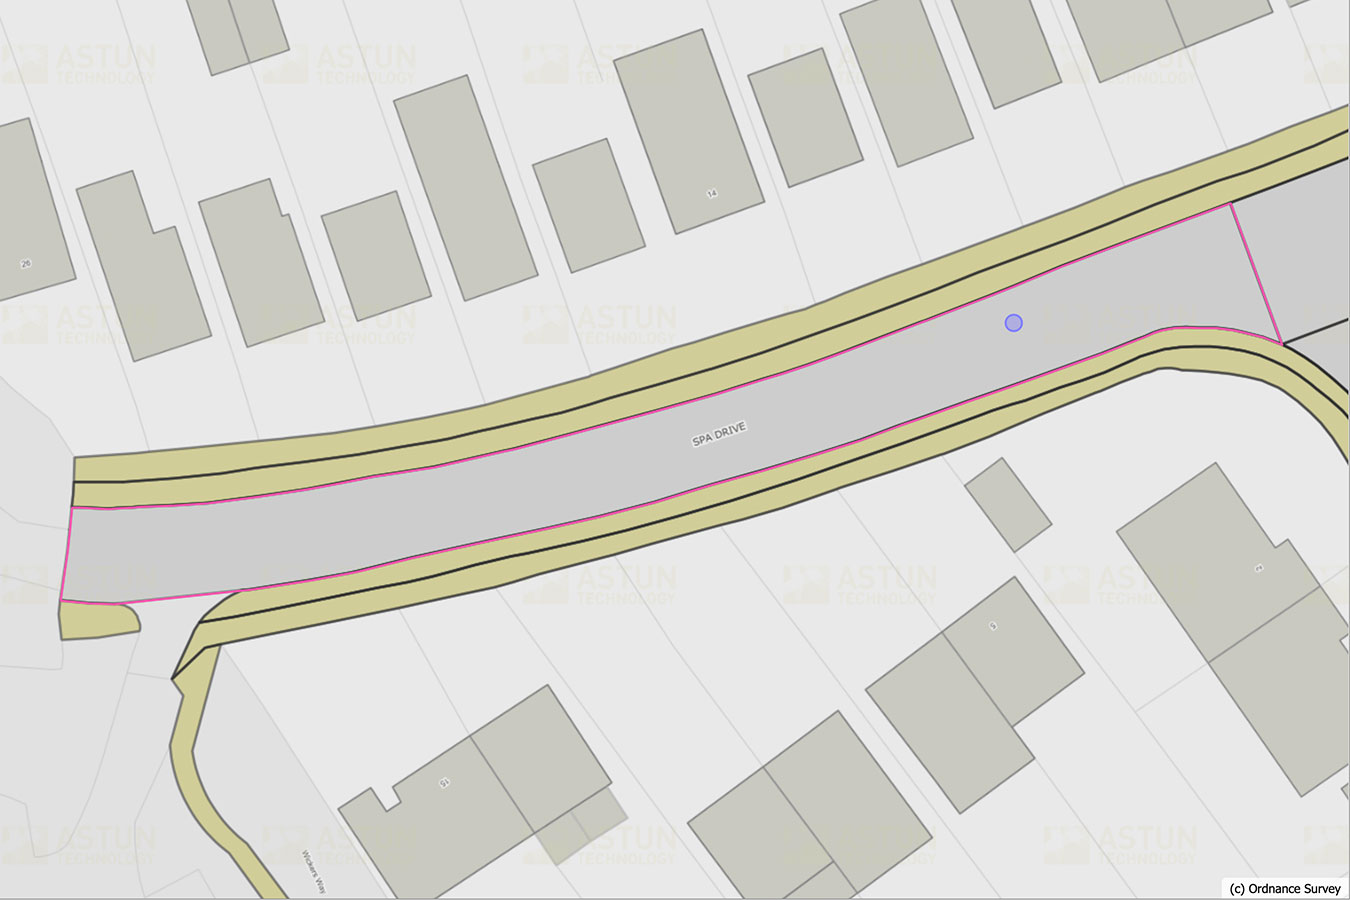
Target Layer
The target layer can be used to ensure that your users can only click where you want them to, e.g. users are constrained to reporting potholes on highways. If no target layers are used, users can report issues anywhere.
LOGGER IN ACTION
Reporting a faulty streetlight
In this example, Logger helps a user correctly identify a streetlight’s location by allowing them to choose from specific assets.
MAP LAYER
OS Premium base mapping
TARGET LAYER
Streetlight point layer
THE REPORT ALSO INCLUDES
Streetlight ID, type of issue and comments from the reporter
LOGGER IN ACTION
Fly-tipping
In this example, users are provided with a web map as an alternative channel for reporting fly-tipping. Users can precisely locate the site, and the application can query ownership and adoption layers to determine responsibility. It can even be configured to allocate a job to the area’s clean-up team.
MAP LAYER
OS Premium base mapping
TARGET LAYER
Local Authority boundary area
CONTEXT LAYERS
A layer of council-maintained land (this may contain Land Registry layers showing non-LA owners) and a layer of reponse team areas
Try it for yourselfTHE REPORT ALSO INCLUDES
A description of the fly-tip
Back office integration
Save time by automatically sharing fault reports with back office systems, including



Share this info with colleagues
This five minute non-technical read provides a short introduction to Logger. It includes a walk through of the user experience, links to more technical documentation and answers several FAQs.
Download the PDFOther ways to use Logger
Logger is a user-friendly way to gather information about a range of issues
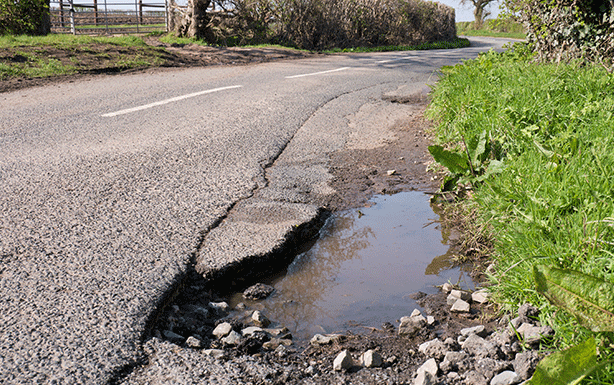
Potholes
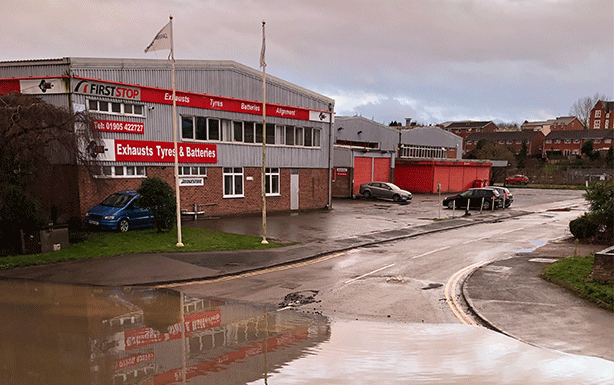
Drainage & flooding

Graffiti
Even more use cases for Logger…
For food hygiene issues to footpath obstructions!
Get more infoRequest a demoNews & views
We publish regular articles about GIS and its use in the public sector
Introducing the Managed Integration Service (MIS)
Discover the stress free way to connect planning systems to your Spatial Data Warehouse.
Read moreJoin Astun at the PSGA Conference 2024
The joint Geospatial Commission/Ordnance Survey (OS) PSGA one-day member conferences are back! Join us in York, Edinburgh, London or Cardiff.
Read more
